Table of Contents
Observability Dashboard
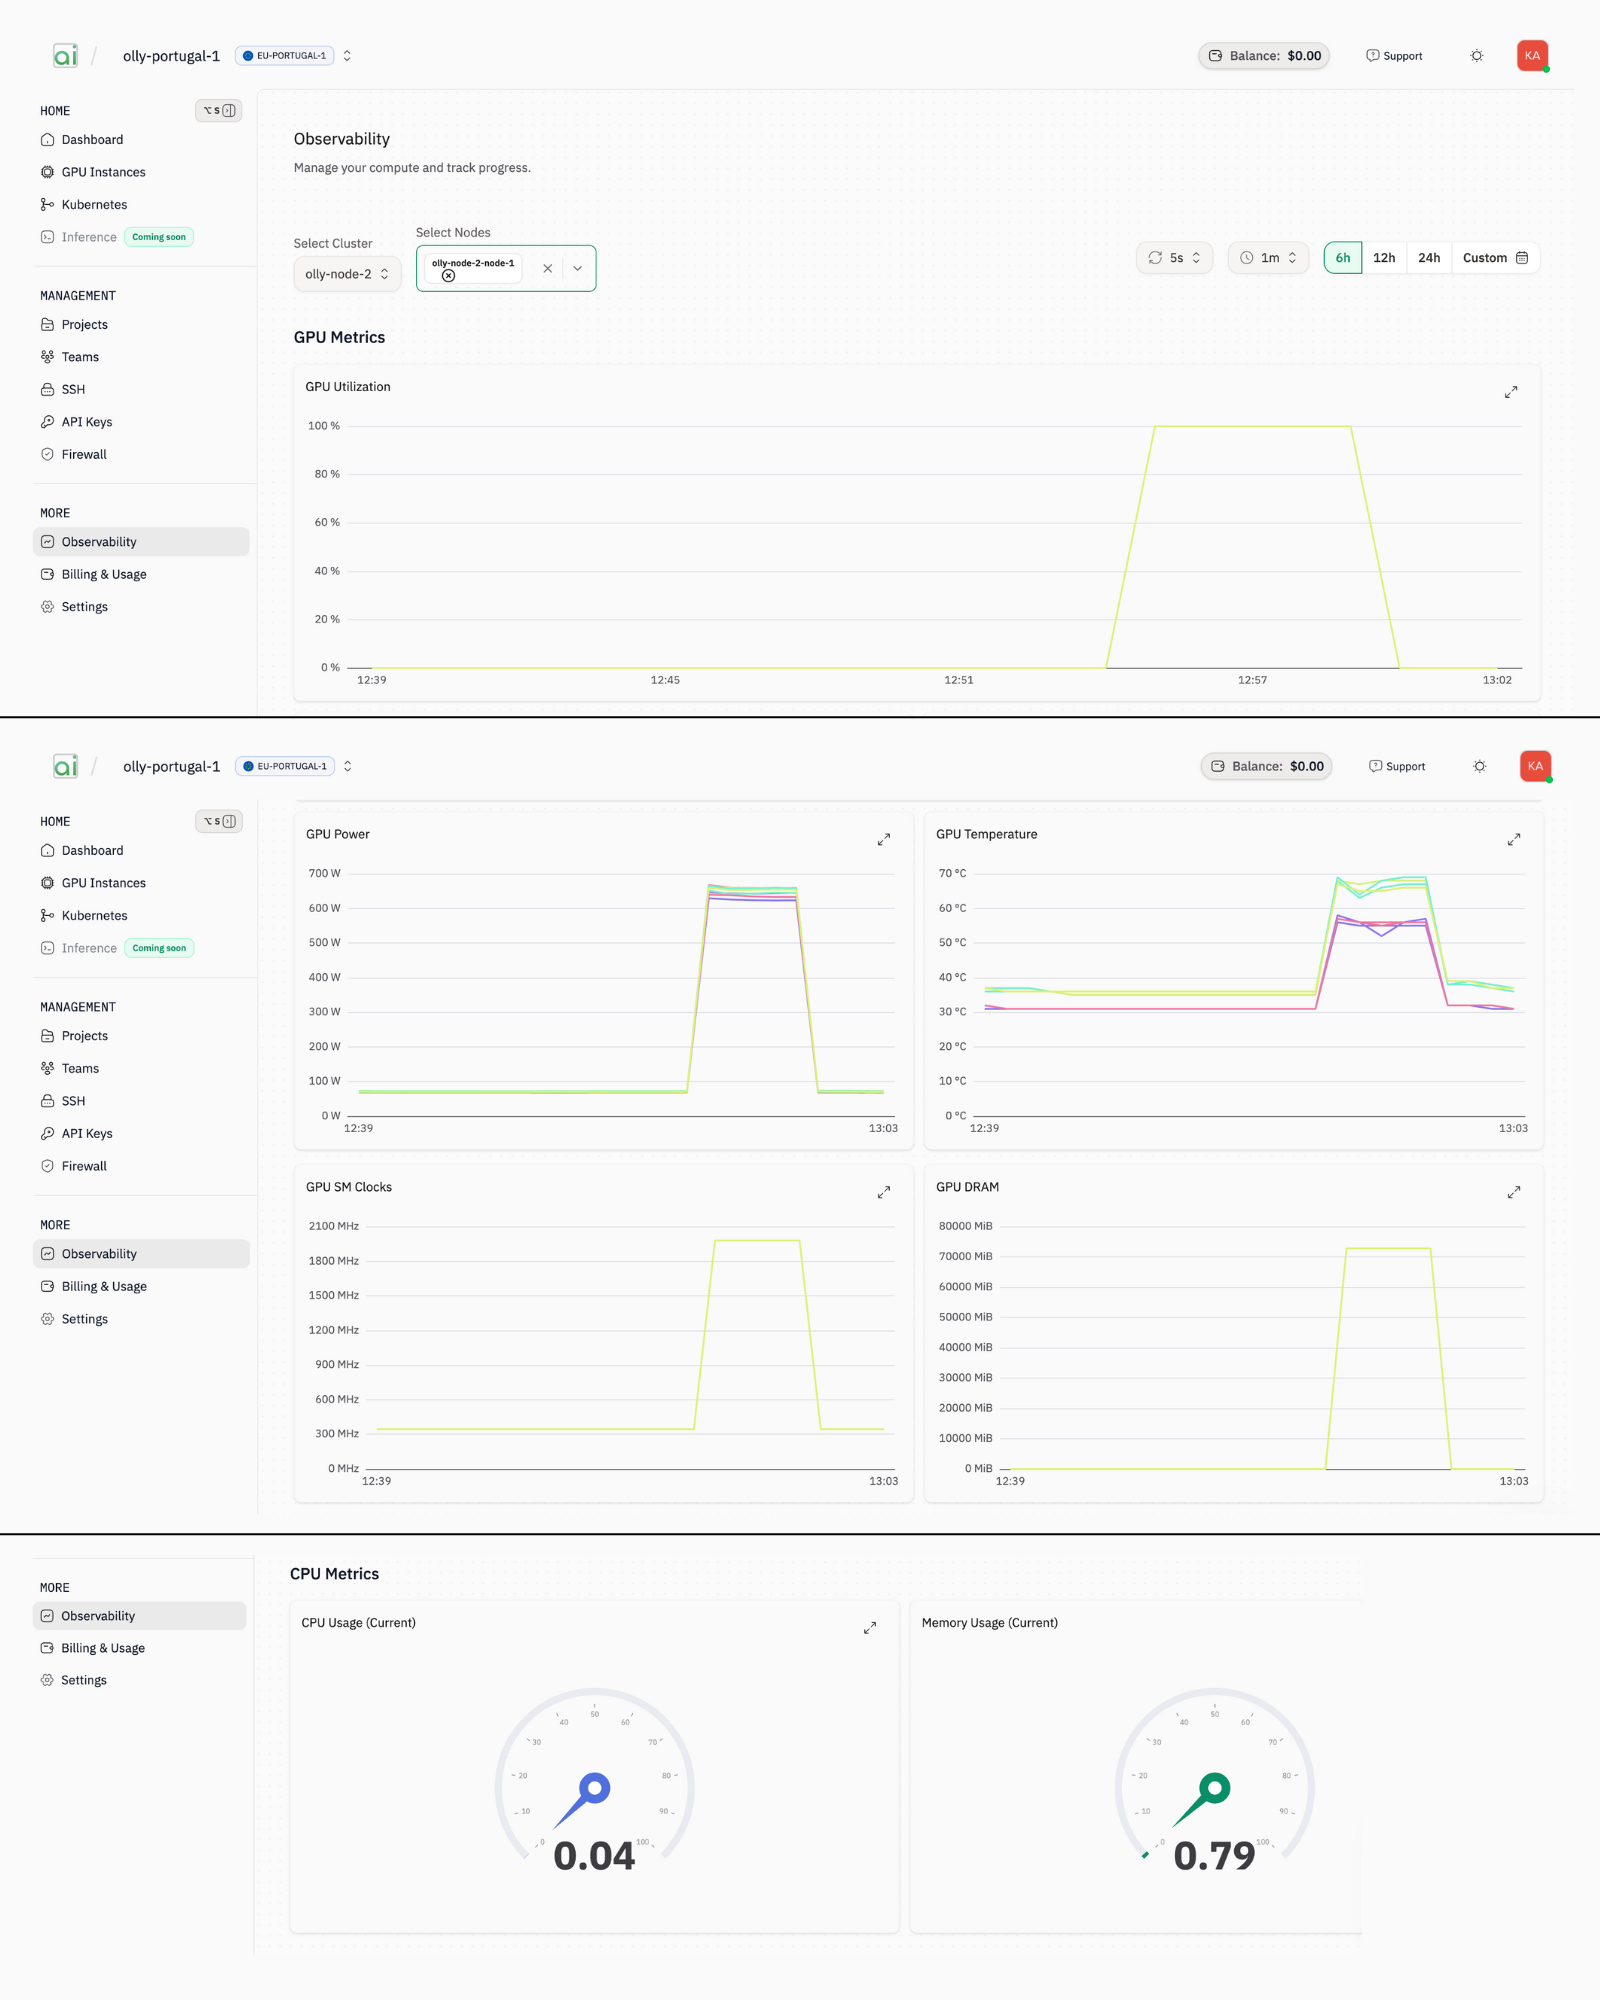
Real-time visualization of cluster health metrics, allowing you to track resource utilization across specific nodes and timeframes to ensure optimal performance. Access the Observability dashboard from the left sidebar under MORE > Observability.Selecting Nodes to Monitor
- Select Cluster: Choose your cluster from the dropdown (e.g.,
k8s-7xdu304ghh-v1) - Select Nodes: Choose one or more nodes to monitor (e.g.,
k8s-7xdu304ghh-v1-node-1) - Set Time Range: Use the time range buttons to select the monitoring window:
- Quick options:
6h,12h,24h - Or use
Customfor a specific range
- Quick options:
GPU Metrics (Time Series)
| Metric | Description |
|---|---|
| GPU Utilisation | Percentage of time the GPU was actively processing CUDA kernels (0-100%) |
| GPU Power | Power consumption in watts |
| GPU Temperature | Temperature in °C |
| GPU SM Clocks | Streaming Multiprocessor clock frequency in MHz |
| GPU DRAM | GPU memory usage in MiB |
CPU Metrics (Gauges)
| Metric | Description |
|---|---|
| CPU Usage (Current) | Real-time CPU utilization percentage |
| Memory Usage (Current) | Real-time system RAM consumption |
GPU Debugging
Systematic workflows to identify performance bottlenecks, diagnose thermal throttling, and resolve common training failures by correlating resource metrics.Steps to Debug on the Observability Screen
-
Navigate to Observability
- Click Observability in the left sidebar under MORE
-
Select Your Target
- Choose the cluster from Select Cluster dropdown
- Select the specific node(s) from Select Nodes dropdown
-
Set Appropriate Time Range
- For recent issues: Use
6h,12h, or24h - For historical analysis: Use
Custom
- For recent issues: Use
-
Analyze GPU Utilisation
- Look for patterns correlating with your task progress
- Sustained ~100% indicates the GPU is consistently executing CUDA kernels
- Periodic dips suggest idle time between kernel launches (data loading, synchronization)
-
Check GPU Temperature and SM Clocks
- If temperature approaches 80-85°C and SM Clocks drop, thermal throttling is occurring
- Normal operation: SM Clocks stable around 2100 MHz or as per GPU specs
-
Monitor GPU DRAM
- Gradual increase without release may indicate memory leak
- Sudden spikes near capacity risk OOM errors
-
Correlate with CPU Metrics
- High CPU Usage + Low GPU Utilisation = Data pipeline bottleneck (GPU waiting for data)
- Low CPU Usage + Low GPU Utilisation = Task may be idle or blocked
Common Workload Patterns
| What You See | GPU Utilisation | Other Metrics | Likely Cause |
|---|---|---|---|
| Training running smoothly | High (80-100%), steady | Stable SM Clocks, Temperature < 80°C | Workload is GPU-bound as expected |
| Training slower than expected | Periodic dips to 0% | High CPU Usage | Data loading can’t keep up with GPU |
| Job crashes with OOM | Drops before crash | GPU DRAM near max | Batch size too large for GPU memory |
| Training stalls or hangs | Drops to 0%, stays low | Low CPU, low GPU Power | Deadlock, NCCL timeout, or I/O wait |
| Inconsistent training speed | Fluctuating | Variable SM Clocks | Contention from other workloads on node |
| Gradual slowdown over time | Decreasing trend | Rising GPU DRAM | Memory leak in training code |
| Multi-GPU scaling issues | Low on some GPUs | Uneven GPU DRAM usage | Imbalanced data distribution or model parallelism |
| Job fails after hours | Was normal, then drops | Temperature was elevated | Potential hardware instability |
Burn Test
Stress-testing protocols designed to push GPUs to their thermal and power limits to ensure hardware stability before production deployment.Overview
Burn tests stress-test GPUs to verify stability under sustained high load. This helps identify hardware issues before deploying production workloads.Steps to Perform Burn Test
-
SSH into the Node
-
Install gpu-burn
-
Run the Burn Test
-
Monitor on Observability Dashboard
Open the Observability dashboard and watch for:
Metric Expected During Burn Test GPU Utilisation ~100% sustained (continuous CUDA kernel execution) GPU Power Near TDP (max power) GPU Temperature Rising, should stay < 85°C GPU SM Clocks Stable at boost frequency (~2100 MHz) GPU DRAM Elevated but stable -
Interpret Results
- PASS: All metrics stable, no SM Clock drops, temperature under control
- FAIL: SM Clocks dropping (throttling), temperature exceeding limits, or computation errors in terminal
What to Capture
NCC Test
Benchmarks for validating inter-GPU communication bandwidth and latency (NVLink/PCIe), which are essential for distributed training performance.Overview
NCC (NCCL - NVIDIA Collective Communications Library) tests verify GPU-to-GPU communication performance, essential for distributed training workloads.Steps to Perform NCC Test
-
SSH into the Node
-
Install nccl-tests
-
Run All-Reduce Test
-
Monitor on Observability Dashboard
Metric Expected During NCC Test GPU Utilisation Periodic bursts during collective operations GPU DRAM Active memory transfers visible CPU Usage Low (GPU-to-GPU communication) -
Analyze Terminal Output
The test outputs bandwidth numbers. Compare against expected values:
Interconnect Expected Bandwidth NVLink 3.0 ~600 GB/s NVLink 4.0 ~900 GB/s PCIe 4.0 ~25 GB/s